In the ever-evolving world of mobile apps, keeping track of the right metrics is key to understanding your app’s performance. With so many possible indicators out there, it can be overwhelming to decide which ones to focus on.
In this article, we’ll break down 19 important mobile app KPIs that you should keep an eye on in 2025. These metrics will help you gauge user engagement, financial performance, and overall app health, so you can make informed decisions moving forward.
Key Takeaways
- User Acquisition Cost helps you understand how much you’re spending to gain new users.
- Daily and Monthly Active Users show how engaged your audience is over time.
- Retention Rate indicates how well your app keeps users coming back.
- Churn Rate measures the percentage of users who stop using your app.
- Lifetime Value estimates how much revenue a user will generate during their time with your app.
- Session Length gives insight into how long users are interacting with your app.
- Average Revenue Per User helps assess the financial performance of your app.
- App Store Rating reflects user satisfaction and can impact visibility.
User Acquisition Cost
Okay, so let’s talk about User Acquisition Cost (UAC). It’s basically how much you’re shelling out to get someone to download and start using your app. Think of it as the price tag for each new user you snag. It’s a pretty big deal because if you’re spending more to get users than they’re actually worth, well, that’s not a great spot to be in, right?
- Keep an eye on your marketing spend. Are you throwing money at ads that aren’t really bringing in the right kind of users?
- Look at which channels are working. Maybe those TikTok ads are killing it, but your Facebook campaign is a dud. Double down on what works!
- Don’t forget about organic growth. Word of mouth and good app store optimization can bring in users without costing you a dime (or at least, not much).
It’s super important to keep tabs on your UAC because it directly impacts your profitability. If your costs are too high, you might need to rethink your entire strategy. It’s all about finding that sweet spot where you’re getting enough users without breaking the bank.
It’s also worth noting that there are different ways to measure this. Some people look at Cost Per Install (CPI), which is just the cost to get someone to download the app. Others look at Cost Per Acquisition (CPA), which is the cost to get someone to actually do something valuable in the app, like make a purchase or sign up for a subscription.
If that distinction is important to make within your app, you can measure both KPIs. On average, the cost per install of an app is $1.75 USD, but getting a user to make their first purchase in-app can run you $87 USD.
Knowing your UAC helps you figure out which marketing efforts are actually paying off. Are those fancy influencer campaigns really worth it? Or would you be better off focusing on something else? It’s all about the data, baby!
Daily Active Users
Daily Active Users (DAU) is a super important metric. It tells you how many unique individuals are using your app each day. Think of it as a daily pulse check on your app’s health. If you’re aiming for deep, engaged user sessions, DAU is a KPI you gotta keep an eye on. When people use your app every single day, you know you’ve got something useful and engaging.
How do you improve your DAU? Well, a lot of the same techniques for boosting Monthly Active Users (MAU) apply here too. Real-time user experiences, like chat or even an AI chatbot, can really get people coming back daily. Just don’t go overboard with notifications!
Tracking DAU helps you understand if your app is truly becoming a part of your users’ daily routines. It’s not just about downloads; it’s about consistent engagement.
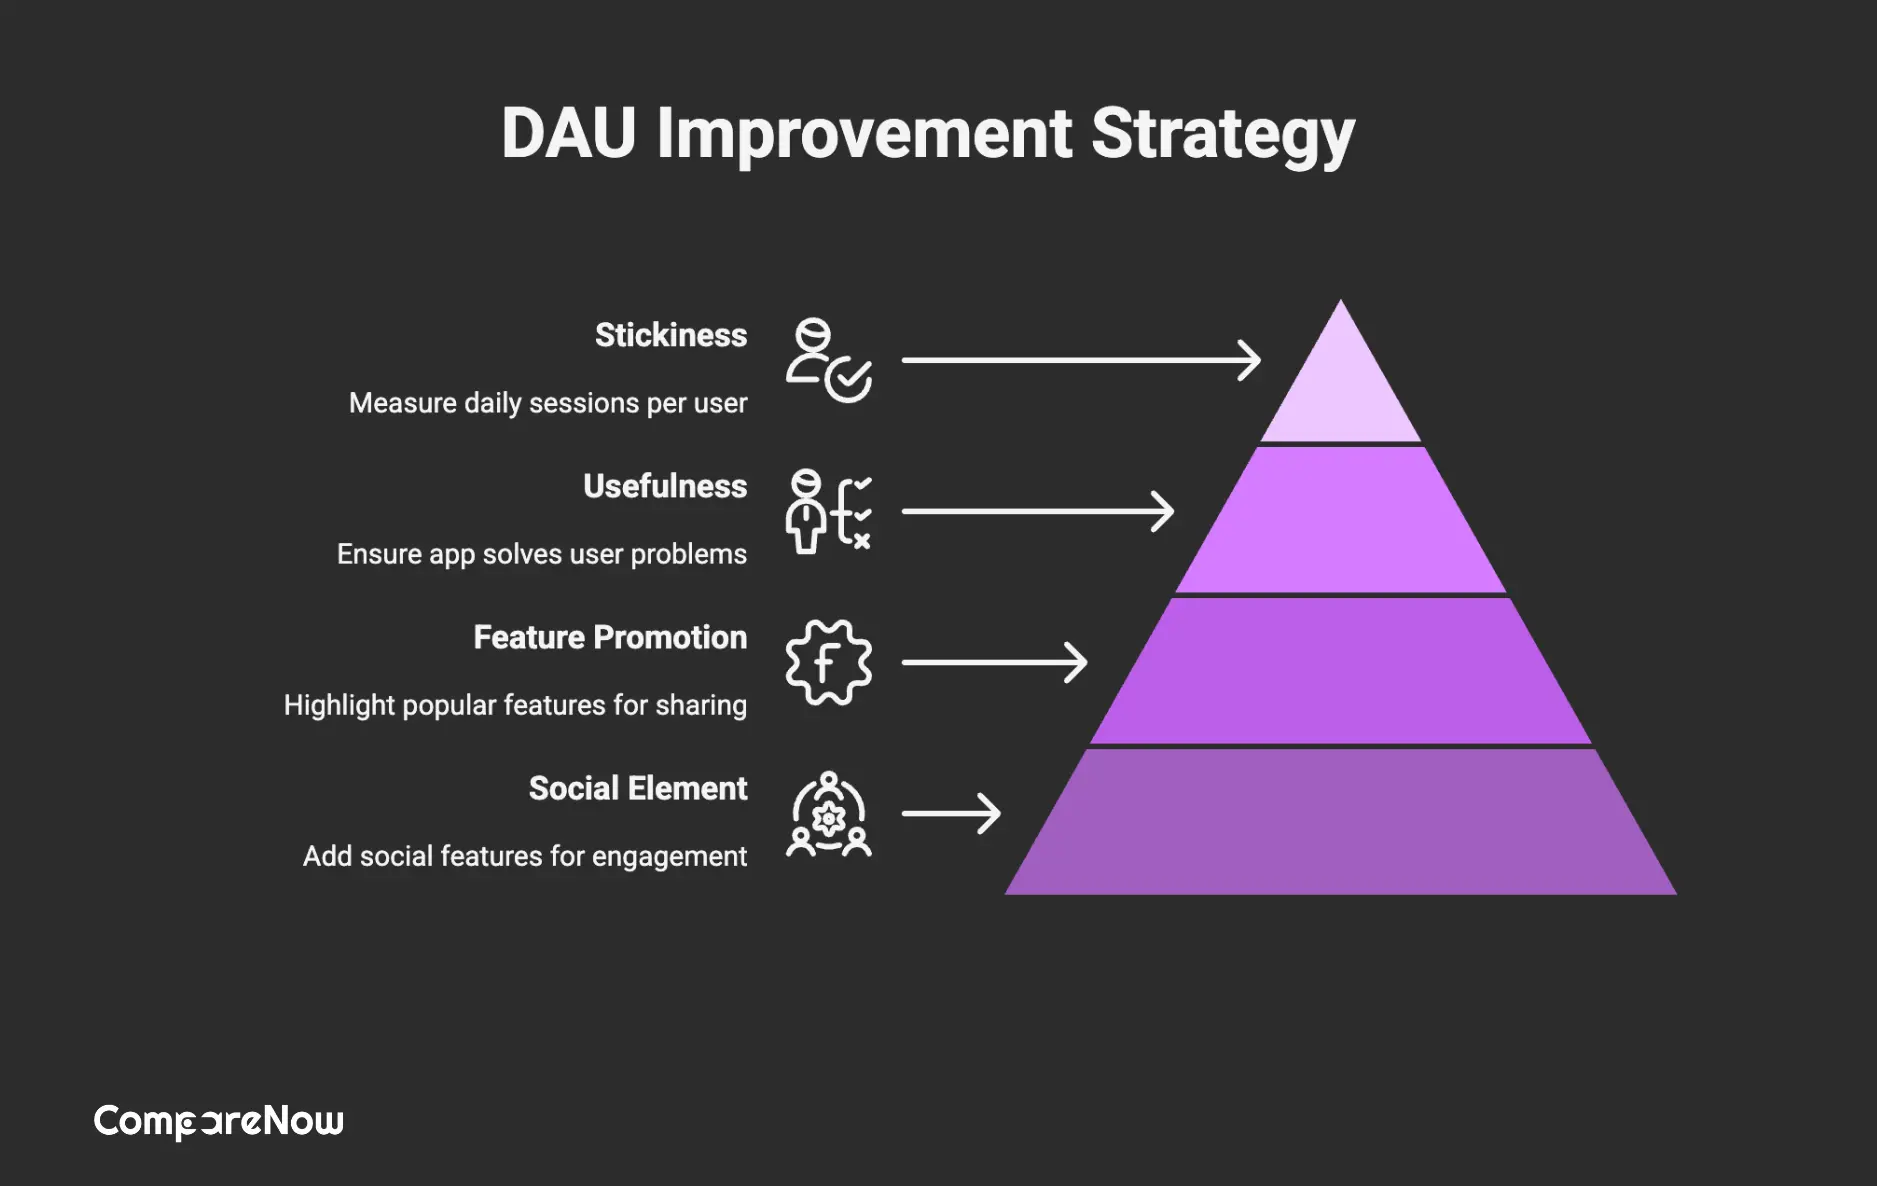
Here are some ways to boost your DAU:
- Add a social element to your app. Products with a social component tend to stand out and get more engagement.
- Find that one feature users love and promote it like crazy. Get them opening and sharing your app.
- Make sure your app is actually useful and solves a problem for your users. If it’s not, they won’t come back.
DAU also feeds into another critical KPI: stickiness. So, it’s all connected. You can also measure daily sessions per daily active user to understand how often daily users engage with your app.
Monthly Active Users
Monthly Active Users (MAU) is all about figuring out how many unique individuals are using your app within a month. It’s a pretty straightforward metric, but it gives you a solid idea of your app’s reach and overall popularity.
Think of it as a health check for your app – are people sticking around, or are they dropping off? It’s a good idea to keep an eye on this, because it can tell you a lot about whether your marketing efforts are paying off and if your app is actually meeting user needs.
MAU helps you understand the overall growth and stickiness of your app.
To get a good handle on MAU, you’ll want to:
- Track MAU trends over time to see if you’re growing, stagnating, or declining.
- Segment your MAU by different user groups (e.g., demographics, acquisition channels) to identify which segments are most engaged.
- Compare MAU to other metrics like Daily Active Users (DAU) to understand user engagement patterns. For example, a high DAU/MAU ratio indicates strong user stickiness.
Monitoring MAU is not just about counting heads; it’s about understanding user behavior and making informed decisions to improve your app and marketing strategies. It’s a key indicator of long-term success.
It’s also worth noting that a high MAU can be a good sign, but it doesn’t tell the whole story. You also need to look at engagement levels and how users are actually using your app.
Are they just opening it once a month, or are they actively using it multiple times a week? This is where other metrics like session length and feature usage come into play. You can improve mobile app downloads by partnering with your marketing team.
Retention Rate
Okay, so retention rate is all about figuring out how many people stick around after downloading your app. It’s not just about getting downloads; it’s about keeping users engaged. Think of it like this: you want users to actually use your app more than once, right?
Retention rate shows you how well your app is doing at keeping users interested over time. If people are ditching your app after a day or two, that’s a big red flag. You want to see those numbers going up, not down.
A good retention rate means your app is providing value and a good experience. If users find your app useful or enjoyable, they’re more likely to keep using it. It’s that simple.
Here’s a few things to keep in mind:
- Track it Regularly: Check your retention rates daily, weekly, and monthly. This helps you spot trends and address issues quickly.
- Segment Your Users: Look at retention rates for different user groups. Are new users sticking around? What about users who made an in-app purchase?
- Compare to Benchmarks: See how your retention rates stack up against other apps in your category. This gives you a sense of where you stand.
It’s a pretty important metric, so keep an eye on it!
Churn Rate
Okay, so churn rate? It’s basically the opposite of retention. Think of it as the percentage of users who are straight-up ditching your app. They might uninstall, cancel their subscription, or just stop using it. It’s not great, but it’s a fact of life in the app world.
It’s worth remembering that not all churn is created equal. Losing a casual user isn’t the end of the world, but if your power users are bailing, Houston, we have a problem. That’s a sign something’s seriously wrong, and you need to figure it out, pronto. You can calculate your app churn rate by subtracting your retention rate from 1.
High churn can be a symptom of several issues: your app might not be delivering the value users expect, it could be hard to use, or maybe the content is getting stale. Whatever the reason, you need to dig in and find out why people are leaving.
Here are a few things to keep in mind:
- Track it consistently: Measure churn over the same period you measure retention (monthly, quarterly, etc.).
- Segment your users: Look at churn rates for different user groups (e.g., free vs. paid, new vs. long-term).
- Investigate spikes: If you see a sudden jump in churn, find out what changed (e.g., a new update, a marketing campaign).
Lifetime Value
Okay, let’s talk about Lifetime Value (LTV). It’s a big deal because it tells you how much money you can expect to make from a user before they stop using your app. Think of it as predicting the future value of each user. Knowing your LTV helps you make smarter decisions about how much you can spend to get new users.
It really boils down to understanding how much revenue a user generates over their entire time using your app. If you know that, you can figure out if your user acquisition cost is worth it.
Here’s a simple way to think about it:
If your LTV is way higher than what you spend to get a new user, you’re in a good spot. If not, you need to tweak things to either get users cheaper or make them worth more while they’re using your app.
To boost your app’s LTV, consider these points:
- Keep in touch with your users regularly.
- Ask for feedback and actually listen to it.
- Offer quick and helpful support.
- Think about implementing a loyalty program. People love feeling valued!
Session Length
Okay, so session length is all about how long people are actually using your app each time they open it. It’s not just about getting them to download it; it’s about keeping them engaged once they’re in. Think of it like this: are people just popping in and out, or are they sticking around and really using what you’ve built?
This metric tells you a lot about the value users find in your app. If sessions are short, something might be off – maybe the app is confusing, slow, or just not that interesting. On the flip side, longer sessions usually mean people are digging what you’re offering.
To get a handle on session length, you can use tools like Google Analytics or Firebase. They’ll let you see how long people are spending in your app on average. To calculate it yourself, just divide the total time of all app sessions by the total number of sessions. You can also look at average session duration to see how engaged users are with your app.
Here are a few things to consider:
- Content is King: Make sure your app has stuff that people actually want to see and use.
- Easy Navigation: If people can’t find what they’re looking for, they’re gonna bounce. Keep things simple and intuitive.
- Performance Matters: Nobody wants to wait around for an app to load. Optimize for speed and responsiveness.
Short session lengths might point to problems with your app’s design, content, or performance. Longer sessions usually mean you’re doing something right, but always look for ways to improve and keep users hooked.
Average Revenue Per User
Okay, let’s talk money! Average Revenue Per User, or ARPU, is all about figuring out how much moolah you’re pulling in from each user on average. It’s pretty straightforward, but super important. Basically, it tells you if your app is actually making enough money per person to be worth it. Think of it as a health check for your app’s financial well-being.
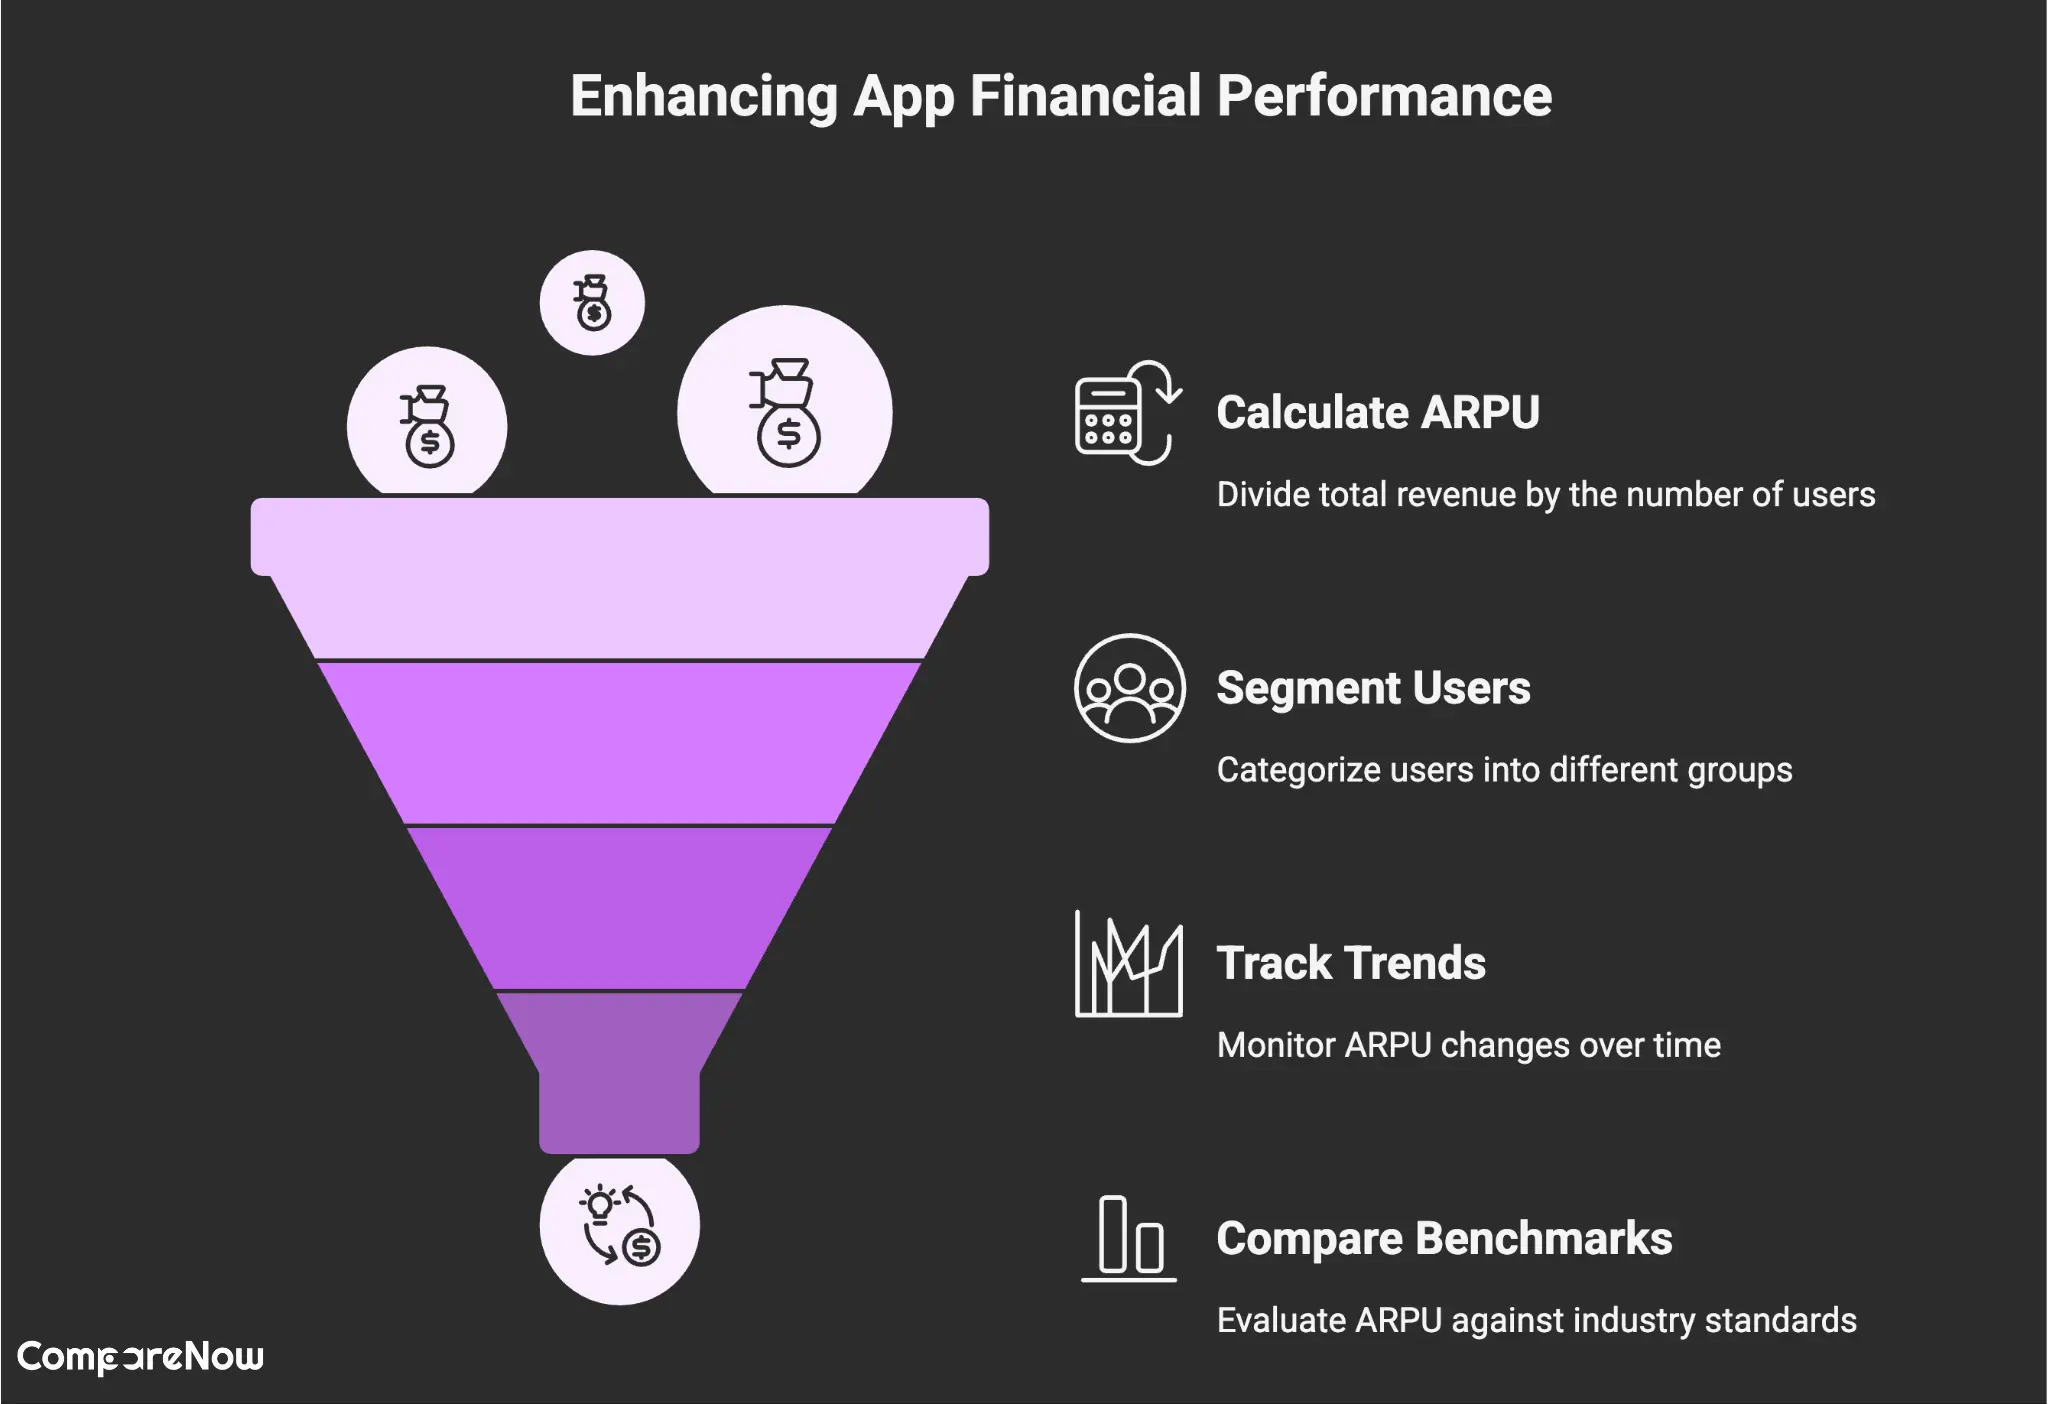
To calculate ARPU, you just divide your total revenue by the number of users you have. So, if you made $10,000 last month and had 1,000 users, your ARPU would be $10. Simple, right? But don’t just look at the number – think about what it means.
Is it enough to cover your costs? Is it trending up or down? That’s where the real insights come from. If you want to improve your app store conversion rate, you need to understand ARPU.
ARPU is a critical metric for understanding the financial performance of your app. It helps you assess whether your monetization strategies are effective and identify areas for improvement.
Here’s a few things to keep in mind:
- Segment your users: Not all users are created equal. Some might be paying subscribers, while others are free users. Break down your ARPU by segment to get a clearer picture.
- Track trends over time: Don’t just look at ARPU for one month. See how it’s changing over time to identify patterns and potential problems.
- Compare to industry benchmarks: See how your ARPU stacks up against other apps in your category. This can give you a sense of whether you’re underperforming or overperforming.
App Store Rating
Okay, let’s talk about your app’s reputation, which is basically what your app store rating tells you. It’s like a quick pulse check on what users think. If it’s high, that’s awesome! It can seriously boost your ASO and get more eyes on your app.
Think of it this way: most people won’t even bother downloading an app if it’s rocking a three-star rating or lower. First impressions matter, and that star rating is often the very first thing potential users see.
Here’s a few things to keep in mind:
- Encourage ratings: Don’t be shy about asking users to rate your app, especially after they’ve had a positive experience. A gentle nudge can go a long way.
- Respond to feedback: Whether it’s good or bad, show users you’re listening by responding to reviews. It shows you care and are actively working to improve the app.
- Monitor consistently: Keep a close eye on your ratings over time. Are they trending up or down? What’s causing the shifts? This data is super valuable for making informed decisions.
Basically, your app store rating is a big deal. Treat it like gold, and watch those downloads climb!
Conversion Rate
Okay, so let’s talk about conversion rates. Basically, it’s all about how many people actually do what you want them to do when they interact with your app. Are they signing up? Are they making a purchase? Are they completing that level? If not, you have a problem.
Conversion rate is the percentage of users who complete a desired action. It’s a super important metric because it directly impacts your revenue and growth. If your conversion rate is low, you’re basically leaving money on the table. You can use platforms like Dynamic Yield to compare retail conversion rates.
Think of it this way: you can have a million people download your app, but if only ten of them actually use it, you’re not doing so hot. Conversion rate tells you how effective your app is at turning users into, well, active users.
Here are some things to keep in mind:
- Define what a conversion means for your app. Is it a purchase? A sign-up? Completing a tutorial?
- Track your conversion rates for different actions within your app.
- Optimize your app to improve conversion rates. This could involve tweaking your UI, improving your onboarding process, or offering incentives.
In-App Purchase Rate
Okay, let’s talk about in-app purchases. This KPI tells you how often people are actually spending money inside your app. It’s pretty straightforward, but super important, especially if you’re using a freemium model. Tracking this helps you see if your monetization strategies are working.
Think about it: are users buying those extra lives in your game? Are they subscribing to the premium features of your productivity app? This metric gives you the answers. It’s a key part of understanding your mobile app marketing kpis.
Monitoring your in-app purchase rate over time can reveal trends related to specific events or campaigns. Did a recent update with new features lead to more purchases? Did a holiday promotion boost sales of virtual items? These insights are invaluable for optimizing your app’s revenue strategy.
Here’s what you should keep in mind:
- Segmentation is key: Look at purchase rates across different user segments. Are your long-term users more likely to make purchases than new ones? This can inform your targeting efforts.
- Analyze purchase patterns: What items or features are most popular? This can guide your future development and marketing efforts.
- A/B test different price points: See how changes in pricing affect your purchase rate. Small tweaks can sometimes lead to big improvements.
User Engagement Score
Okay, so you wanna know how hooked people are on your app, right? That’s where the User Engagement Score comes in. It’s not just about downloads; it’s about how often people use your app and how much they love it. Think of it as a health check for your app’s stickiness.
It’s a combined metric, usually calculated from a bunch of different factors. You’re looking at things like how often users open the app, how long they spend on it, and what features they’re using. Basically, are they just downloading and forgetting, or are they actually getting something out of it?
Here’s what you might consider including in your engagement score:
- Session Length: How long do people use the app each time they open it?
- Feature Usage: Are people exploring all the cool stuff you built, or just sticking to the basics?
- Retention Rate: Are users coming back day after day, week after week?
A good engagement score means people are finding value in your app. A bad one? Time to figure out what’s turning them off. Maybe the UI is clunky, or the content isn’t hitting the mark. Whatever it is, you need to find it and fix it.
Understanding user retention rate is key to improving your mobile app analytics kpis. It’s all about keeping those users coming back for more!
App Load Time
Okay, let’s talk about app load time. It’s pretty simple: how long does it take for your app to actually, you know, load? In 2025, nobody’s got time to wait around. We expect things to be instant. If your app is taking forever to load, people are just gonna bounce. Seriously.
App load time is a critical mobile app performance kpis.
Think about it: you tap on an app, and it just sits there… spinning. How long are you willing to wait? Probably not long. That’s why keeping an eye on this metric is super important.
Here are a few things to keep in mind:
- Optimize your images. Big images = slow loading.
- Clean up your code. Messy code can drag things down.
- Consider using a content delivery network (CDN) to speed things up.
Basically, make sure your app is quick. Your users will thank you for it.
Crash Rate
Okay, let’s talk about something nobody wants to see go up: your app’s crash rate. Basically, this KPI tells you how often your app is failing on users. A high crash rate? That’s a red flag. It means users are having a bad time, and they might just ditch your app for something more reliable. You definitely don’t want that.
Keeping tabs on your crash rate is super important. It’s a direct line to understanding the stability of your app. If things are crashing left and right, you need to figure out why, and fast. Think of it as your app’s health report card – a low grade means it’s time for some serious intervention.
Here’s why you should care:
- User frustration: Crashes lead to unhappy users. Unhappy users leave bad reviews and uninstall your app.
- Lost revenue: If your app crashes during a purchase, you’re losing money. Plain and simple.
- Damaged reputation: A buggy app makes your brand look unprofessional. Nobody wants to trust an unreliable app.
Monitoring your app’s crash rate is not just about fixing bugs; it’s about protecting your investment and ensuring long-term success. It’s a proactive way to keep users happy and engaged.
To really get a handle on things, you might want to look into crash/bug reports.
Customer Satisfaction Score
Okay, so you wanna know if people actually like your app, right? That’s where the Customer Satisfaction Score (CSAT) comes in. It’s pretty straightforward: you ask users how satisfied they are, usually on a scale of 1 to 5 (or 1 to 7, whatever floats your boat). The higher the score, the happier your users are.
Think of it as a quick pulse check. It’s not as in-depth as some other metrics, but it gives you a good snapshot of how people are feeling about your app at a specific moment. Plus, it’s super easy to implement. You can use customer satisfaction metrics to get a better understanding of your app’s performance.
Here’s why it matters:
- Happy users stick around longer.
- Happy users are more likely to recommend your app to others.
- Unhappy users will leave bad reviews (and nobody wants that).
Basically, keeping an eye on your CSAT is like making sure your app is giving people the warm fuzzies. If it’s not, you know you need to make some changes.
So, how do you actually measure it? Well, you can send out surveys after key interactions, like after they complete a purchase or use a new feature. Just keep it short and sweet – nobody wants to fill out a novel.
Here’s a simple way to think about it:
- Send out a CSAT survey.
- Calculate the average score.
- Track the score over time to see if it’s going up or down.
And that’s pretty much it. Keep your users happy, and your app will be happy too.
Net Promoter Score
Okay, so the Net Promoter Score (NPS) is all about figuring out how likely your users are to recommend your app to others. It’s a pretty big deal because it tells you a lot about customer loyalty and whether people are actually happy with what you’re offering.
If your net promoter score (NPS) is looking sad, it’s a sign you need to dig in and find out why users aren’t thrilled.
Think of it this way:
- Promoters (score 9-10): These are your biggest fans. They love your app and will tell everyone about it.
- Passives (score 7-8): They’re okay with your app, but not super excited. They’re not going to go out of their way to recommend it.
- Detractors (score 0-6): These folks are unhappy. They might even tell others to avoid your app.
Basically, you ask users, “How likely are you to recommend this app to a friend or colleague?” and they give you a score from 0 to 10. Then, you use those scores to calculate your NPS.
To calculate your NPS, you subtract the percentage of detractors from the percentage of promoters. The higher the score, the better. A high score means you’ve got a lot of happy users who are basically doing free marketing for you.
If you want to improve your mobile app net promoter score, you can use in-app surveys to get feedback. You can also use customer feedback tools to get a better understanding of how users perceive your app.
Feature Usage Rate
Okay, so Feature Usage Rate is all about seeing which parts of your app are actually getting used. It’s not enough to just launch cool new features; you need to know if people are digging them or if they’re just gathering digital dust. This helps you make smarter decisions about where to focus your development efforts.
Think of it like this: you wouldn’t keep stocking shelves with products nobody buys, right? Same deal here.
Tracking feature usage helps you understand what’s working and what’s not, so you can prioritize updates and improvements that actually matter to your users.
Here’s what you should keep in mind:
- Identify Key Features: Decide which features are most important to track. These could be new additions or core functionalities.
- Set Usage Goals: Determine what a successful usage rate looks like for each feature. This gives you a benchmark to measure against.
- Track and Analyze: Use analytics tools to monitor how often each feature is used and identify any trends or patterns. For example, you can measure feature adoption rate.
It’s also a good idea to segment your users. Are new users using features differently than long-time users? This can give you insights into onboarding issues or the appeal of certain features over time.
Basically, this metric helps you ensure that you’re building an app that people actually want to use.
Push Notification Opt-In Rate
Okay, let’s talk about something super important: push notifications. Specifically, how many people are actually saying “yes” to receiving them. This is your push notification opt-in rate, and it’s a big deal.
A high opt-in rate means more people are open to hearing from you, which is awesome. But a low rate? That’s a red flag that you need to figure out.
Think about it this way:
- Are you asking at the right time? Bombarding users the second they open the app is a no-go.
- Are you explaining the value? People need to know what they’re getting in return.
- Are you making it easy to say yes (and easy to change their mind later)?
If people aren’t opting in, your amazing push notification strategy is basically useless. You’re shouting into the void. So, pay attention to this metric and make sure you’re giving people a good reason to let you into their notification center. You can improve mobile push notification strategy by focusing on the right timing and value proposition.
Here’s a simple table to illustrate:
| Opt-In Rate | Interpretation |
| Below 30% | Needs Improvement. Re-evaluate your approach. |
| 30-50% | Average. Room for optimization. |
| Above 50% | Great! Keep doing what you’re doing. |
It’s not just about the numbers, though. It’s about understanding why people are or aren’t opting in. Ask for feedback, test different approaches, and always put yourself in the user’s shoes.
Social Sharing Rate
Okay, so, how often are people actually sharing stuff from your app? That’s what the social sharing rate tells you. It’s all about seeing if your app’s content is engaging enough that users want to spread the word.
A high social sharing rate usually means people dig what you’re offering and are happy to show it off to their friends. If it’s low? Time to rethink your content strategy, maybe add some features that make sharing easier, or just make cooler stuff, you know?
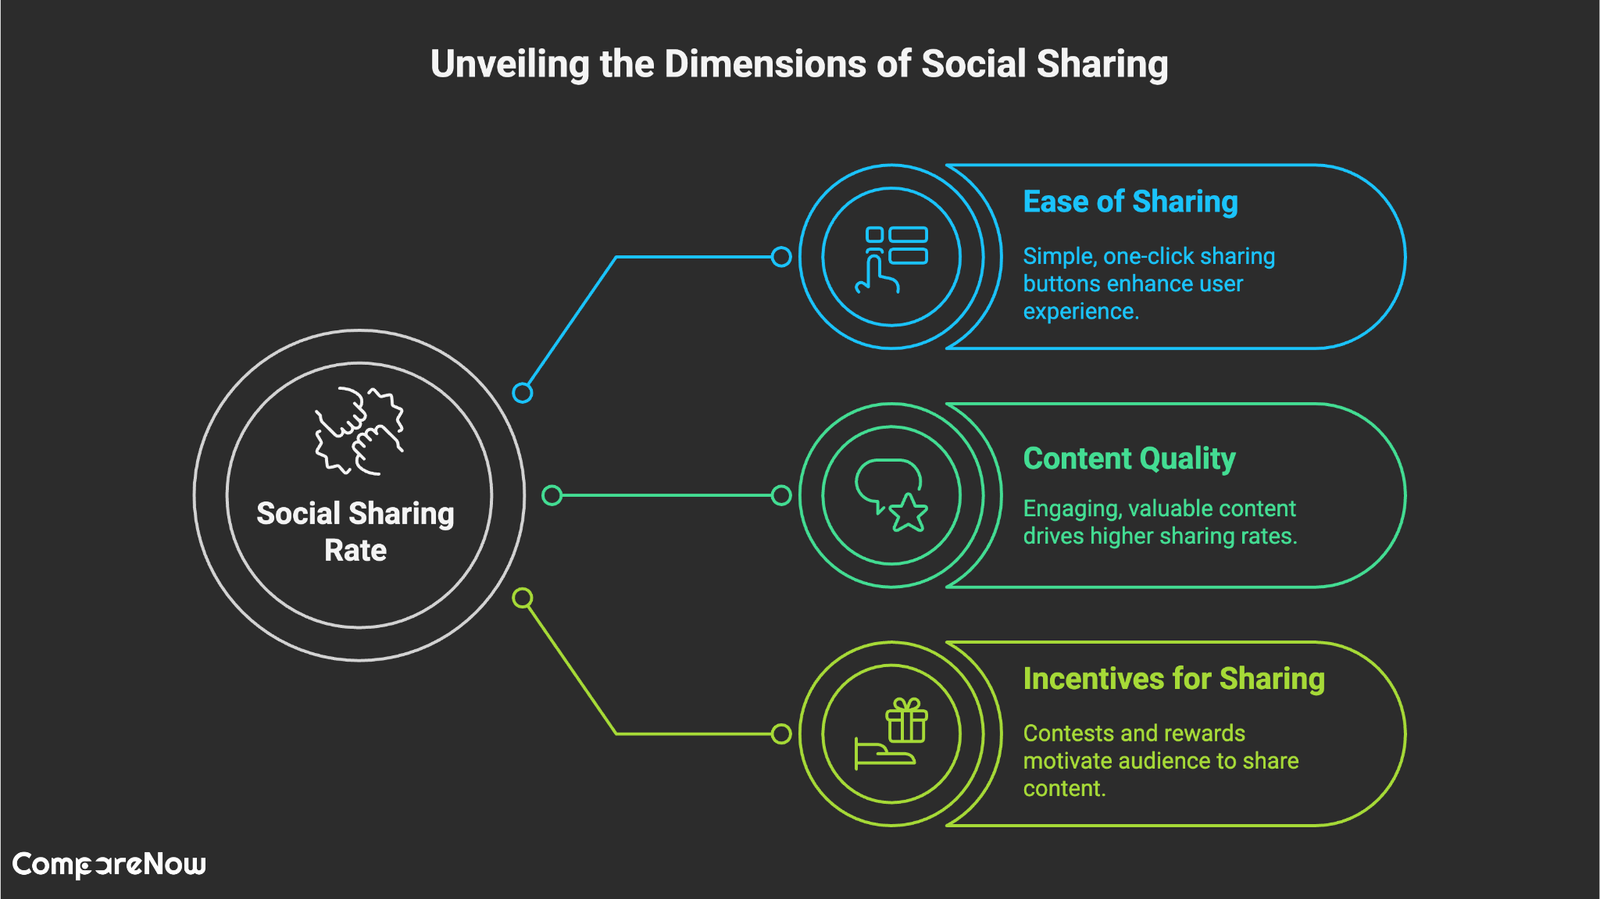
Think about it like this:
- Are there easy ways to share? Like, one-click buttons to post on different platforms?
- Is the content worth sharing? Is it funny, useful, or interesting?
- Are you giving people a reason to share? Contests, rewards, or just plain old bragging rights?
Basically, if no one’s sharing, no one’s seeing. And if no one’s seeing, well, that’s not great for growth. So, keep an eye on that social sharing rate and make sure you’re giving people something they want to shout about.
The social sharing rate is a key measure of how often people share your content on social media. A higher sharing rate means more visibility and engagement for your brand.
To boost your sharing rate, encourage your audience to share your posts by adding easy-to-use share buttons. Want to learn more about improving your app’s visibility? Visit our website for tips and resources!
Wrapping It Up
So, there you have it—19 key app KPIs to keep an eye on in 2025. Tracking these metrics can really help you understand how your app is doing and where it needs to improve. Remember, it’s not about tracking every single number out there; it’s about picking the right ones that matter for your goals.
Focus on a few key indicators, and you’ll be able to see trends and make better decisions. As the app landscape keeps changing, staying on top of these KPIs will help you adapt and thrive. Good luck out there!
Keep Evolving With Your Metrics
It’s also important to remember that your app’s KPIs aren’t set in stone. As your app grows, your goals will shift and so should the metrics you track. Maybe you’ll start focusing more on monetization, or perhaps user engagement becomes your top priority. Make it a habit to review your KPIs regularly and adjust them as needed to stay aligned with your evolving strategy. This proactive approach ensures you’re always measuring what truly matters.
Frequently Asked Questions
What is a mobile app KPI?
A mobile app KPI, or Key Performance Indicator, is a measurement that helps you see how well your app is doing. It shows whether your app is meeting its goals.
Why should I track KPIs for my app?
Tracking KPIs helps you understand how your app is performing. It can show you what is working and what needs to be improved.
How many KPIs should I focus on?
It’s best to start with about 10 to 20 KPIs. This way, you can manage them easily and see clear results without feeling overwhelmed.
What does User Acquisition Cost mean?
User Acquisition Cost is how much money you spend to get a new user for your app. This helps you understand how effective your marketing is.
What are Daily Active Users?
Daily Active Users are the number of unique users who use your app each day. This number helps you see how engaged your users are.
What does Retention Rate measure?
Retention Rate shows how many users keep using your app over time. A high retention rate means users find your app valuable.
What is Churn Rate?
Churn Rate is the percentage of users who stop using your app. It’s important to track because it shows if users are leaving.
What does Lifetime Value mean?
Lifetime Value is the total money a user is expected to spend on your app during their time as a user. It helps you understand how valuable a customer is.
What is Session Length?
Session Length measures how long users spend on your app each time they open it. Longer sessions usually mean users are more engaged.
What is Average Revenue Per User?
Average Revenue Per User, or ARPU, tells you how much money you make from each user on average. This is important for understanding your app’s profitability.
Why is App Store Rating important?
App Store Rating reflects how users feel about your app. A high rating can attract more users, while a low rating can push them away.
What is a Conversion Rate?
Conversion Rate measures how many users take a desired action, like making a purchase or signing up. It helps you see how effective your app is at encouraging actions.